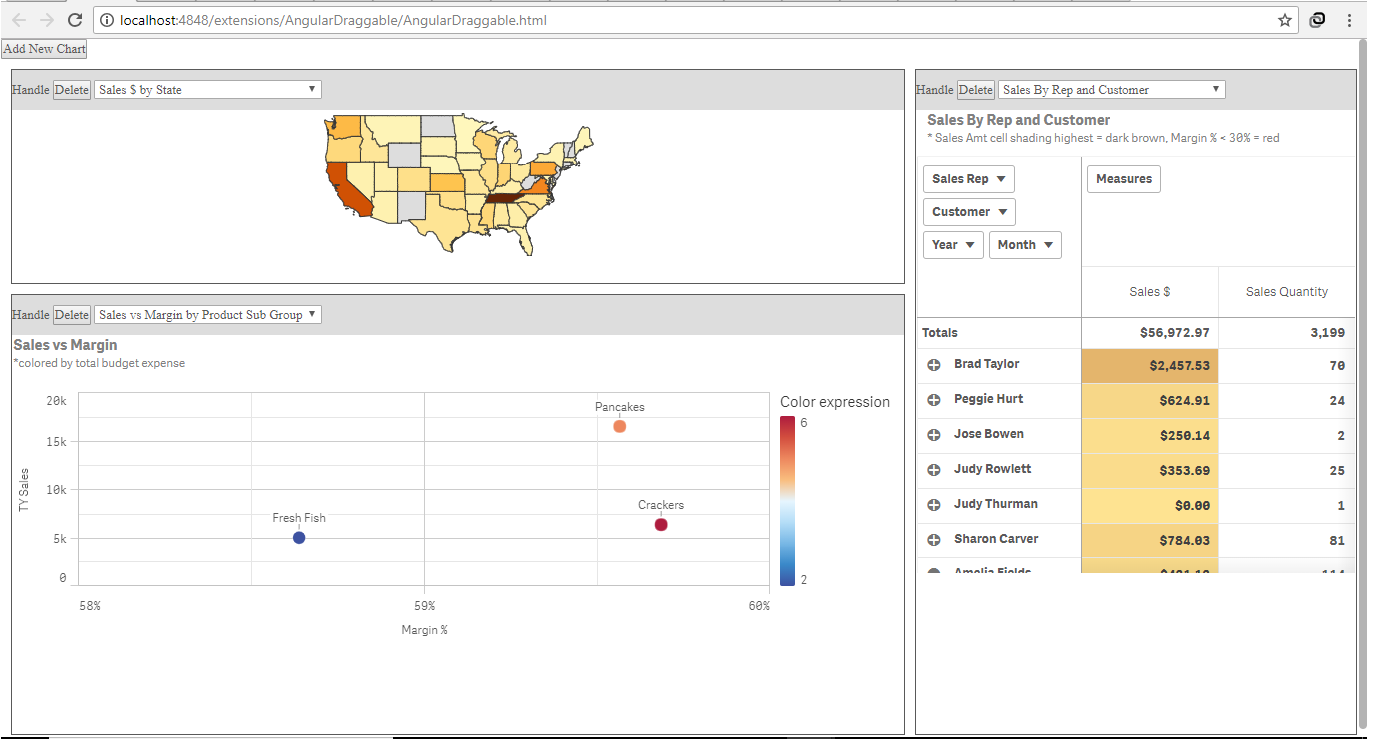
I started doing my first angularJS mashup and hence was trying to get an already created angular code. Then I landed upon this angular-gridster example.
This triggered an idea of extending this to a Qlik dashboard that can be managed/ created on the fly.
The following is the approach
- Set up angularJS gridster inside the mashup
- Get MasterObjects and provide it to the user
Result: An empty canvas for the user to build their own dashboard from the master visuals without the need to code at all.
I have split the blog into two. This part explains the set up of angular gridster. The second part: Get Master Objects explains populating the widgets with visuals. The blog does not cover the method to persist these settings. You could use either a flat file or DB.
The complete example can be downloaded here: Qliksesnse Selfservice Mashup
Setting up angularJS gridster in the qlik mashup
Implement the gridster inside the mashup
This was quite straight forward except for the challenge of loading the gridster.min.js. Since it had a define function, I had to include it as part of the requires load rather than the usual way of adding it to the html section. If you want it to be in html rather than in requires, you will have to download the gridster code and change it.
Following are the gridster files required
i. Gridster javascript
ii. Gridster CSS
Change the grid settings
Gridster comes with various setting options that is quite comprehensive. You can refer to the setting and try various scenarios. I went with the default setting that the example had. These settings will help you determine the user experience.
Change the widget structure
The example had the widgets in the standaradItems array. This array has basic parameters that are required to draw the widget
In order to have a placeholder for the charts, an id field is included.This will be used to identify the div where the dynamic chart will be loaded within the widget.
The widget structure will look like this now
Id:1,
size: {x: 2, y: 1},
position: [0, 0]
}
Adding and Removing Widgets
The example did not have these functions. So, I had to add them with simple functions as below
Add a Widget
var maxId=0;
for (var i=0;i<$scope.standardItems.length;i++) { if ($scope.standardItems[i].Id>maxId)maxId=$scope.standardItems[i].Id;
}
$scope.standardItems.push({Id:maxId+1,size:{x:2,y:2}})
}
Delete a widget
$scope.standardItems.splice($scope.standardItems.indexOf(item),1);
}
Changes to html
Following changes were made to html, to include the Add, Delete buttons and the div to hold the visuals
<div style="border: solid 1px;">
<div class="ddd" style="width: 100%; background: #ddd; padding: 10px 0px;">Handle
<button>
Delete
</button></div>
<div id="visual{{item.Id}}" class="qvobject"></div>
</div>
</div>
Now the mashup is ready with the gridster and the user will be able to add new widget or remove the existing widget. The user will also be able to resize or move the widgets around.

Leave a Reply