

This qlik sense extension – D3 scatter plot matrix is an inspiration from the D3 visualization explained here. This initial version is an attempt to emulate what was done already in D3 and port it to Qlik sense. In future more options will be available.
Download and Install
You can download the extension from the below link. If you like to contribute you can also use the GIT HUB
Extract and copy contents of the folder in the Extensions folder on your desktop or server. It usually is in the My Documents/Qlik/Sense/Extensions folder
Download Qlik Sense Extension – D3 Scatterplot Matrix
Measures and Dimensions
The extension allows only one dimension and 5 measures. Though the chart type does allow more measures, i have restricted it to 5 so that it best fits in view.
You can modify it to include more measures.
Making selections
Though making selection is not included in the current version, the Element number is available in the data provided to the chart. You can enable it yourself or please wait for an update that will be available soon. Personally, I beleive that this visualization must be used to find the correlation across multiple measures rather than finding a specific data point.
Handling of large data
The default rendering can handle 1000 rows of data. This extension fetches data gradually when the total data exceeds 1000 records. However, the chart will render and refresh as per the data fetched. So the users will not have any delay in seeing the data
Please use it and share your comments.
Options
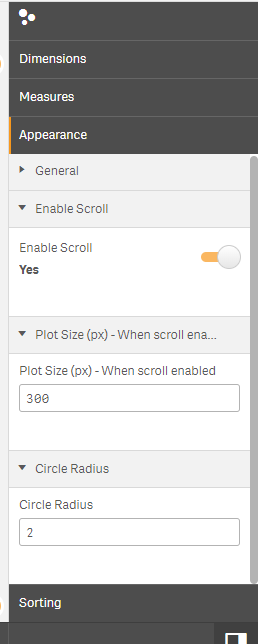
Enable Scroll
This options enables two ways to render the visualization. Fit screen mode or Scroll mode. In fit screen mode, all the plots will be rendered in the given space (determined by the height of the widget).
When Enable Scroll is set to Yes, the other options mentioned below can be used to adjust the size of the plot and can give you a clear picture of eachc plot.
Plot Size
This option sets the size of each plot. This is effective only when the scroll is enabled using the option above.
Circle Radius
This option will change the size of the bubble in each plot.
Leave a Reply