

This blog explains how to plot two series of data in built-in XY or scatter chart of Qlik sense. Well, technically it will be a single series i.e., it uses data a from a single column for X-axis and from another column for Y-axis. But we will use color by expression property to show it as two series to make more sense of the data. The built-in scatter plot requires a minimum of one dimension and two measures. Optionally, we can include one more measure to determine the size of the bubble. There is no option to include another series of data. In this blog we will see the following steps involved in the Qlik Sense – scatter plot multiple series.
- Set up data structure and property
- Define Measures using Set Analysis
- Highlight series using Color by Expression
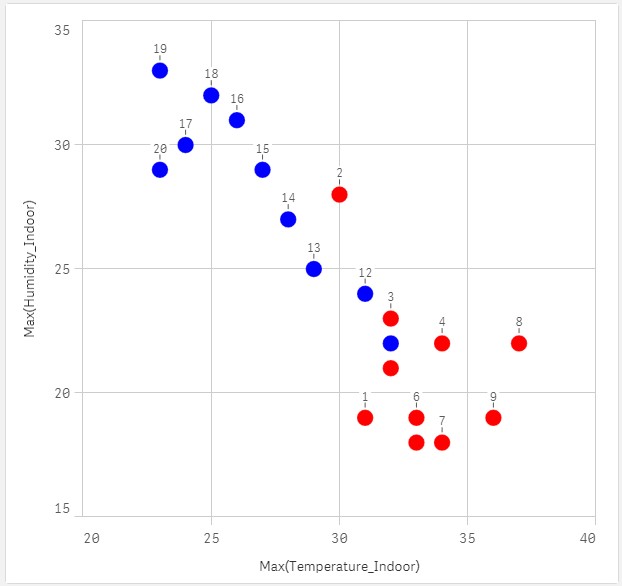
For demonstration purpose, let us take an example lab experiment that measures the indoor/ outdoor temperature and humidity of a place. There are two instance of the experiment and 10 observations made in each instance. We will plot the indoor temperature against the indoor humidity from the two experiment and the final result will look like below

Set up data structure and property
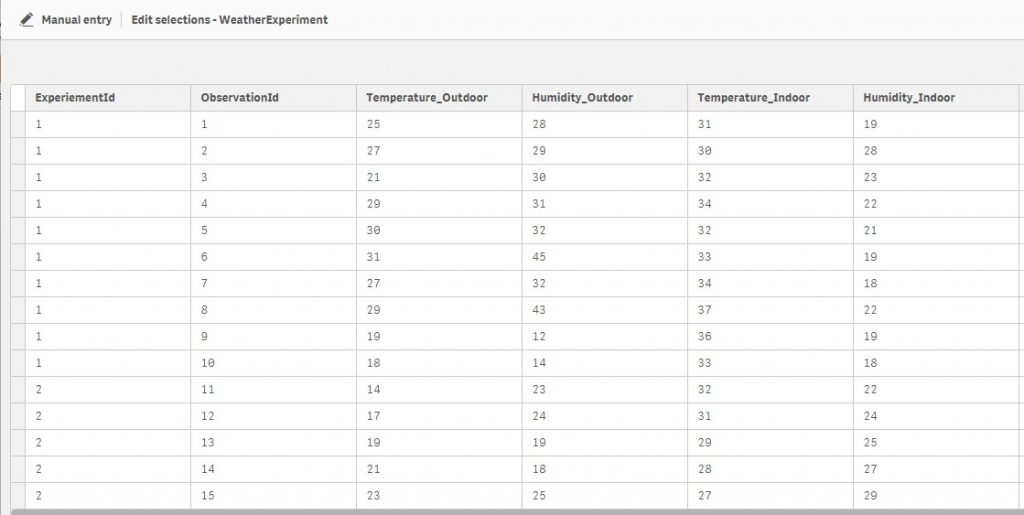
We can use the manual entry feature of Qlik sense “Add Data” to create columns and actual data. The data looks like below. If you look at the data, the observation Id will be unique for each row and we will use that as the dimension. Now load the data, create a sheet and lets create the scatter plot.
Define Measures and Dimensions
Dimension
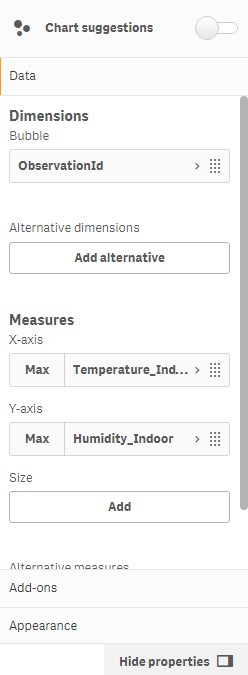
Drag and drop the scatter plot and add Observation Id as the dimension. Its not necessary that this dimension always has to be unique but in our example, this is the unique field that lets us lot each every row as a data point.
Measures
X-Axis: We will plot the indoor temperature in the X-Axis. Since there needs to be an aggregate value for the measure, we will use max() function. Since the observation id is unique we will get the actual value of each row
Y-Axis: We will plot the indoor humidity in the Y-Axis.
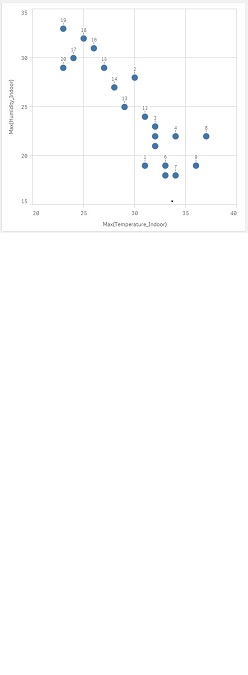
At this point, the graph looks like below: all data points (observations) plotted in a single color.
Highlight Series Using Color By Expression
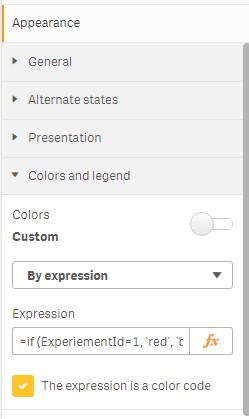
Now in order to differentiate the experiment 1 and 2, we will use the “Color by Expression” under Appearance > Colors and Legend
We will use the Experiment field as below to differentiate each experiment series. And also, mark the expression as color code
=if (ExperiementId=1, 'red', 'blue')
Now the chart looks like below with the experiment 1 series in red and the experiment 2 series in blue. We can use this color code option to differentiate the data points into multiple series.
Demo
Limitations
Technically its still a single series that gets data getting data from one column for x-axis and another column for y-axis. It is not possible to plot data from different columns for each series. Thus in our example, we can not plot Outdoor data and indoor data in the same scatter plot.
Similar Tips: I have written another blog that explains how to color code combo chart conditionally without changing the color of line. Please check it out.
Leave a Reply