

This Qlik sense extension D3 K Means Cluster is adapted from the D3 – Cluster – Forced Layout and also makes use of the javascript based cluster library . This visualization extension achieves the following
- Computes K – Means cluster for n-dimensional dataset with no additional server/ service requirement. Just drag and drop the visualization and measures and dimension and that’s it.
- Visualize the cluster – however, it does not maintain the distance between the point but only the cluster group
- Download the cluster grouping in the form of csv
Download and Install
The extension can be downloaded using the below link.
Download – Qlik sense Extension – D3 K-Means Cluster
Install the extension in your desktop or server.
Demo
How to use Qlik sense extension D3 Circle pack?
Number of Dimensions and Measures
The extension requires
- Only one dimension
- Minimum of 1 and a maximum of 5 (you can add more in the definition if required)
Color of the Clusters
The extension currently uses 20 color palette from D3. More options will be added in subsequent releases
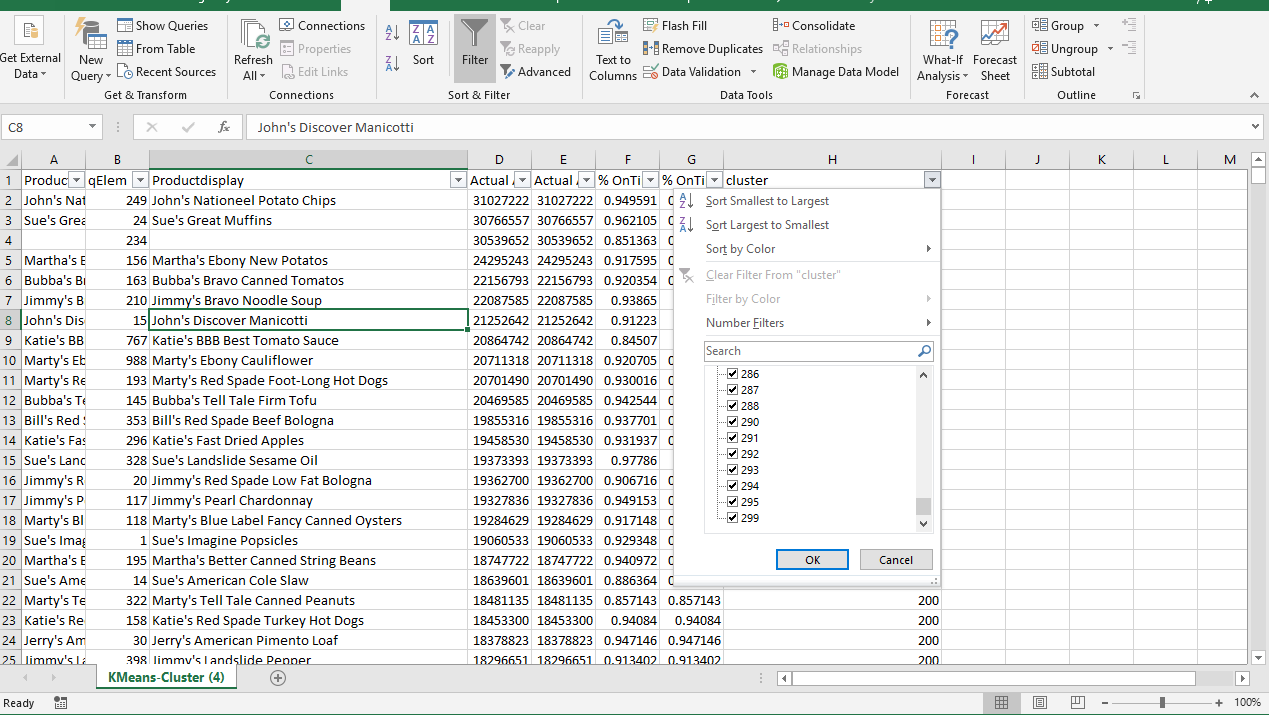
Download Cluster Data
Since the cluster data is not part of the hypercube, you can not download using the default export to excel option. So, we created an option to download the cluster data. You can export data in the form of csv using the Download Cluster Data button on the top left corner of the visualization.
Handling of large number clusters
The data handles large data in an asynchronous mode. The initial fetch gets 1000 records. The performance of clustering is good for large data set. However, the visualization slows down as the number of data points grow more than 1000. We are working on optimizing the same.
The below video shows an example of 7000+ data points classified into 300 clusters
Cluster Visualization Limitation:
The cluster visualization only highlights the grouping. However, it does not preserve the distance between the data points. Any suggestions to improve the same is welcome.
Generic Options under Appearance section
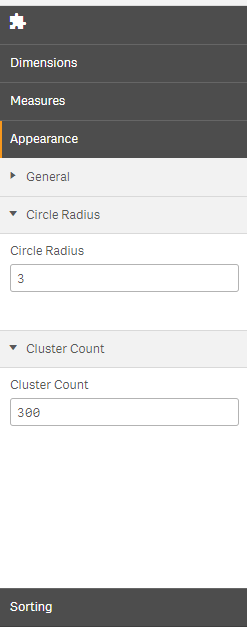
Circle Radius: This is the radius of the circle that represents each data point. This will set the outer circle color that groups all the dimensions under it
Cluster Count: This is the number of clusters to classify the data points. The default number is 4.
Selection: The extension does not have the selection capability now. But keep checking this page for update.
Contribution
If you like to contribute, please go to the GITHUB page. Otherwise, please use it and share your feedback.
HI, i have tried the extension in Qliksense desktop, however the chart is always blank, regardless of what dimensions and measures that is passed in.
Seek your kind assistance! Thank you!
Will you be able to send the measure details and console log of the page. You may have to launch it from a web browser to get the console log.
HI, i have tried the extension in Qliksense desktop, however the chart is always blank, regardless of what dimensions and measures that is passed in.
Seek your kind assistance! Thank you!
Hi, The chart is always blank, regardless of what dimensions and measures that is passed in.
Can you please check for any errors in the Developer console (F12) of your browser ?