

This Qlik sense Extension Geo Maps Leaflet Mapbox is my first attempt to explore Geo Analytics using leaflet and mapbox. Though Qlik sense provides some built-in capabilities and a separate product for Geo Analytics, I would like to explore the same using some other tools. This is a very primitive extension that just tests the possibility of integration. There are multiple options in map box that can be leveraged to make a sophisticated geo extension. My initial try was with Google Maps but the number of API calls that Google allows were not enough and hence went for mapbox. To access mapbox capabilities through API, this extension uses the open-source leaflet library. The website has lot more examples of advanced geo analytics.
Download and Install
The extension can be downloaded using the below link.
Download – Qlik sense Extension – Geo Maps Leaflet Mapbox
Pre-Requisite
Before you use the extension, complete the following steps.
- Create an account in Mapbox
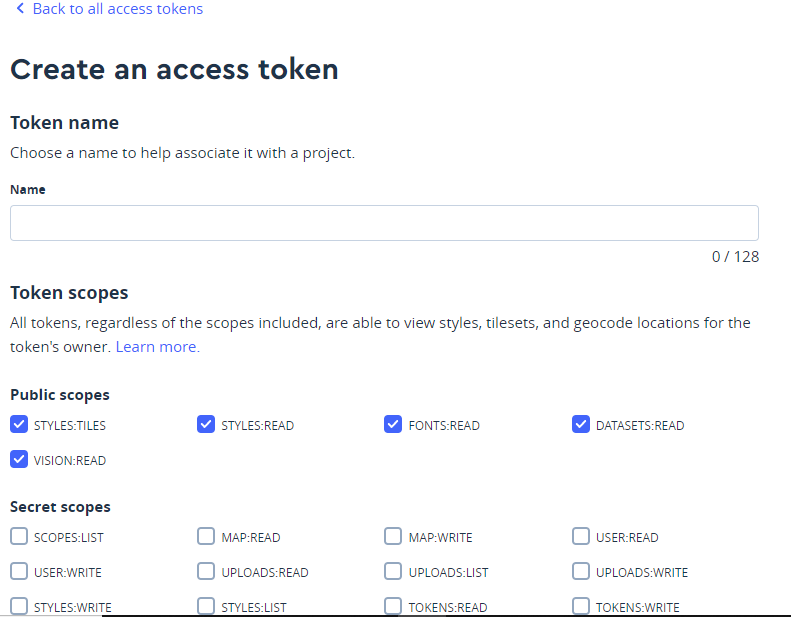
- Once the account is created, generate an access token. Typically, you will have a default access token. However, its better to create one for each application. I used the default access for this experiment. But you can customize it, if you are familiar with it.
- Now you can see the access token associated with your account in the access token page of your account
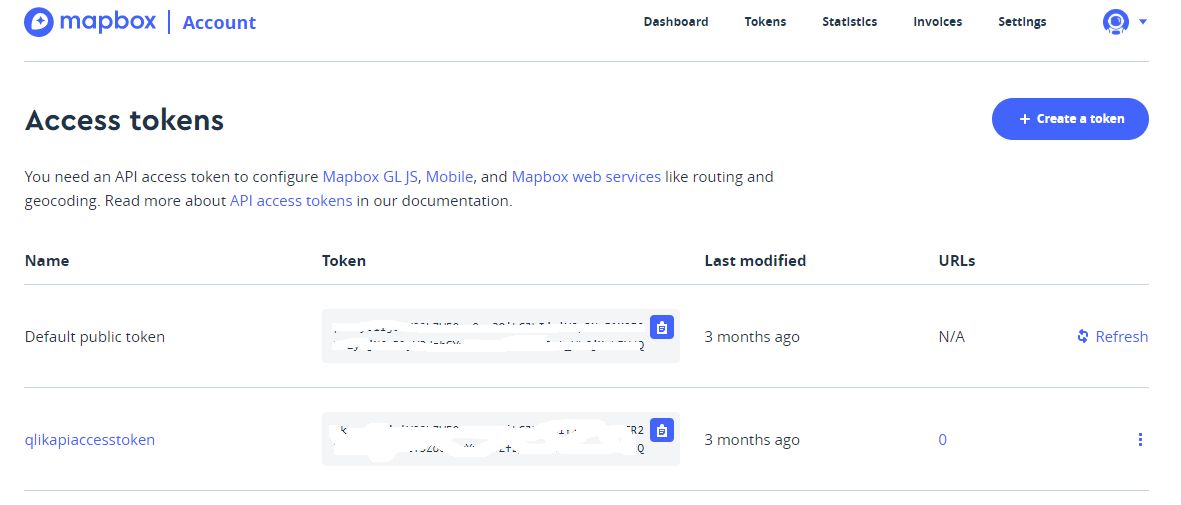
- Keep the access token handy and you will use it in the extension
- Get a sample data. For this example, I have used the sales sample data from sharecsv.com that contains latitude and longitude
Extension Details
Dimensions and Measures
There are three dimensions and 2 measures available in the extension
The first dimension gives the description of the geo space. If you plot country, then its a country name field. If you plot city then its a city field.
The second and third dimensions are latitude and longitude co-ordinates respectively.
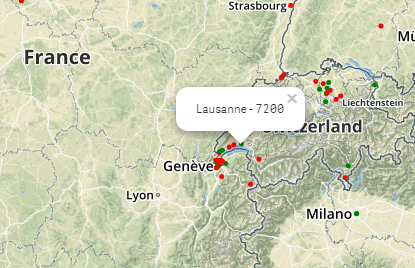
The first measure is the value that will be displayed in the tool tip on click of the data points.
The second measure is optional and it determines the color of the data point. The result must be a color code.
Options
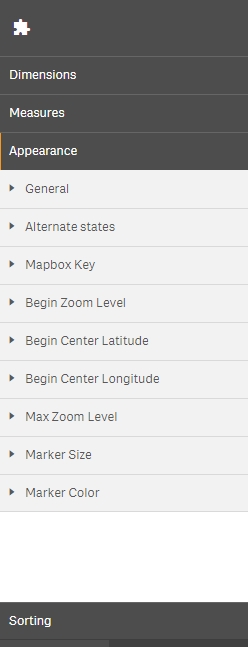
Mapbox Key: This is the API Token Key from the access token page of mapbox.
Begin Zoom Level: This is the zoom level at which the map will be loaded initially. A zero zoom level will have the map zoomed out.
Begin Latitude, Begin Longitude: These are settings that sets the center of the map view on load.
Max Zoom Level: This will restrict the zoom level that user can have on the map.
Market Size: This determines the size of the marker circle.
Market Color: The default marker color when the second measure is not present.
Demo
Leave a Reply