

I started doing my first angularJS mashup and hence was trying to get an already created angular code. Then I landed upon this angular-gridster example.This triggered an idea of extending this to a Qliksense selfservice mashup that can be managed/ created on the fly by the users.
The following is the approach
- Set up angularJS gridster inside the mashup
- Get MasterObjects and provide it to the user
Result: An empty canvas for the user to build their own dashboard from the master visuals without the need to code at all.
I have split the blog into two. The first part: Set up angular gridster explains the implementing angular gridster from the above example in qlik mashup. This part: Get Master Objects explains populating the widgets with visuals. The blog does not cover the method to persist these settings. You could use either a flat file or DB.
The complete example can be downloaded here: Qliksesnse Selfservice Mashup
Populating the widgets with visuals
Get Master Visuals and let user select them
There is a blog about getting the App Details using Qlik API that explains how to get the master objects from an app using getList() function.
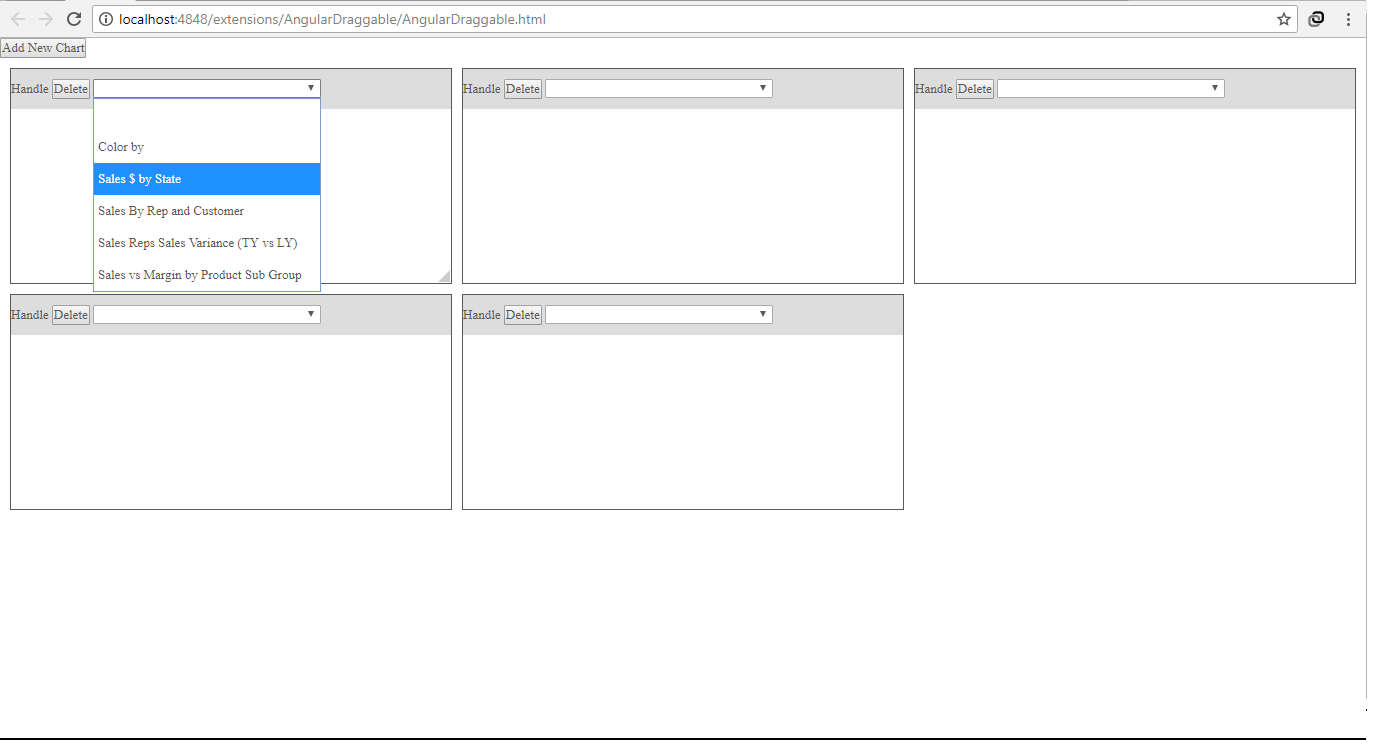
Once the master objects are retrieved, the dropdown inside each widget will be populated with the master object title.
The code will also have the way to get the visuals from each sheet. However, this approach only returns the id of the object and not the readable title. Hence, it may not be easy for the user to choose the right visuals. Meanwhile, I will any other way to fetch the non-master visuals from all the sheets with the title.
Change the widget structure
To hold the id of the visual that is supposed to be rendered inside the widget, a new property is added to the widget.
visualId: this will hold the id of the master object that is selected in the dropdown.
The widget structure will look like this now
Id:<>,
visualId: <>
size: {x: 2, y: 1},
position: [0, 0]
}
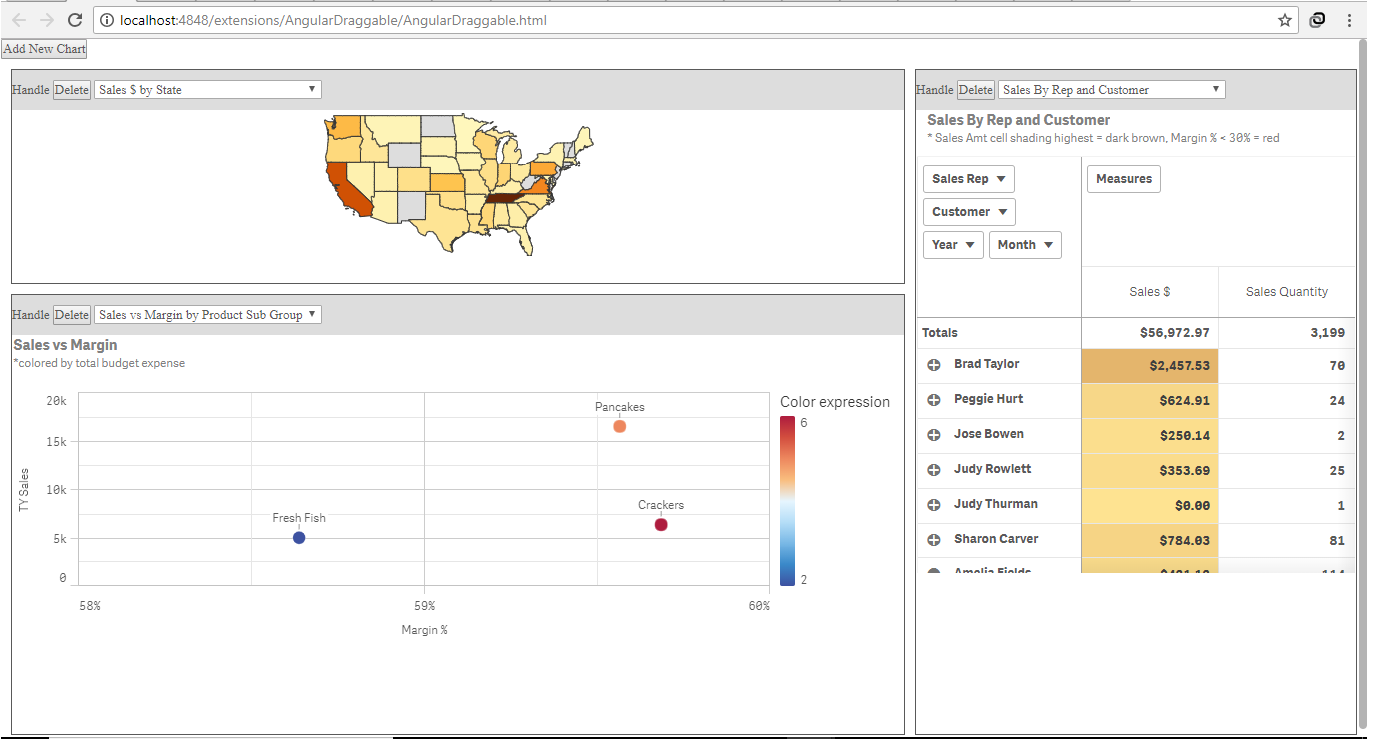
Render the Visual
This is straight forward using the getObject method. The drawVisual method gets the widget details (id and visualId) and calls the getObject () function.
Changes to the qvobject class
The qvobject is changes a little to accommodate chart inside the widget.
Now the mashup is ready with the gridster and the master objects. User will be able to add visuals as need to the dashboard and create view as desired.
Leave a Reply