

This blog is shows how to implement What if analysis in Power BI . I wrote a blog earlier on how to implement What if Analysis in Qlik Sense using variables . For the demonstration, I used the concept of creating Sine or Cos wave or Circle. I will show how to achieve the same in Power BI as well.
The Observations
I used 361 observations so that it is possible to plot circle. For this demo i uploaded a single column file with numbers from 0 to 360 into the table called Counter. But you can also create the table using generateSeries function.
Implement What if Analysis in Power BI using variables
In Power BI we have the concept called parameters that lets you give inputs to the dashboard.
The Parameters
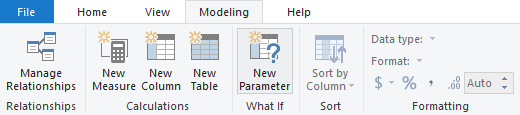
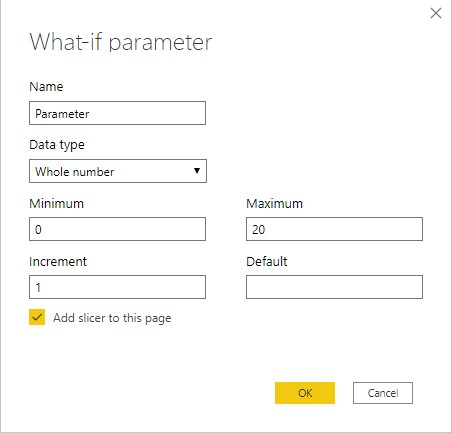
Create following parameters using the New Parameter Option in the modelling tab. While adding the parameter, please check the option “Add Slicer to the Page”. This will add slicers that will help change parameters to the page.
Waves Parameters:
| Parameter | Reason |
| Shape | To switch between sine and cos waves |
| Wave Amplitude | Parameter that determines the height of the wave |
| Wave Frequency | Number of waves in a second |
| Seconds to Plot | Number of seconds to plot in the graph |
Circle Parameters:
| Parameter | Description |
| Circle Center X | X co-ordinate of circle center |
| Circle Center Y | Y Co-ordinate of circle center |
| Circle Radius | Radius of the circle |
Measures
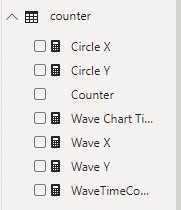
Create the following measures for the waves
WaveTimeCounter = 1/ (360 / 'Seconds to Plot'[Seconds to Plot Value])
Wave X = [WaveTimeCounter] * max(counter[Counter])
Wave Y = if ([Shape Value]=0,WaveAmplitude[WaveAmplitude Value]* Sin(2 * Pi() * WaveFrequency[WaveFrequency Value]* (counter[Wave X])),WaveAmplitude[WaveAmplitude Value]* COS(2 * Pi() * WaveFrequency[WaveFrequency Value]* (counter[Wave X])))
Wave X is the measure used in X axis to plot waves.
WaveTimeCounter will determine the incremental value for the time depending on the number of seconds we choose to plot so that we distribute the time equally across the 361 observations. Since we use the counter as the dimension, we use max(counter) to get the single value to use in measure as measure expects only the single value.
Wave Y is the measure that determines whether to plot Sine or Cos wave depending on the value of the parameter “Shape”.
The Navigation
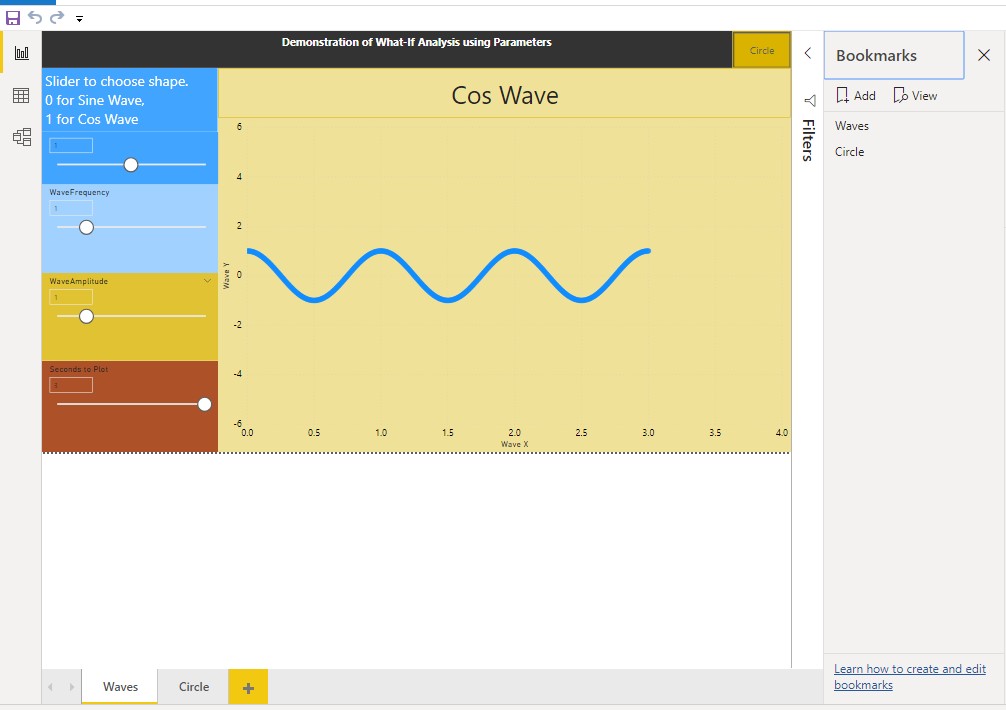
As mentioned earlier, we will use XY/ scatter chart to plot x and y values. Unlike Qlik sense, Power BI does not provide a capability to dynamically change the title or axis ranges of chart axis. Neither does it provide the capability to change the display text of slicers dynamically. Because of this we use two pages, one for waves and the other for circle. Then we use bookmark and button to switch between two pages.
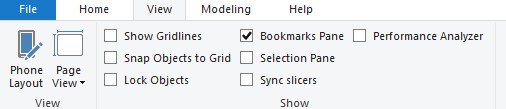
To enable the bookmark pane, got to the view menu on the ribbon and check the bookmark pane as shown in the image below. The bookmark pane will appear and then you can go to the waves page and click “Add” in the bookmark pane and give it a name. Similarly you can do so for Circle Page also.
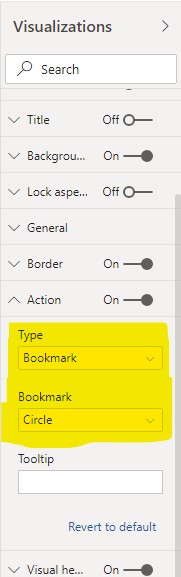
Now that we have created two pages with bookmarks, we create a button on each page. This button will have the action to go to the bookmark url. To insert button, go to Home menu on the top ribbon and click on Insert Button. When you select the button, in the visualization pane on the right, you will see the action section. Choose Type as bookmark and Bookmark as the other page.
Now you will be able to switch between two pages by “Ctrl+click” on the buttons.
The Graph
We have to create two graphs, one in Waves page and the other in Circle page. As mentioned earlier in this blog, we will use SV/ Scatter chart to plot the x and y values with same size for all the bubbles. In order to show the change in the wave or circle based on the changes in the parameters, we will have fixed predefined values for the axis ranges. An example is shown below whereFor example, we set the axis for the y axis of wave graph to be from -6 to +6. We have set the parameter range for amplitude to be a maximum of 5. So when we change the amplitude, we will be able to see the change in the height of the wave easily. If the range is set to auto then the scale will adjust and the wave height will always be the height of the chart.
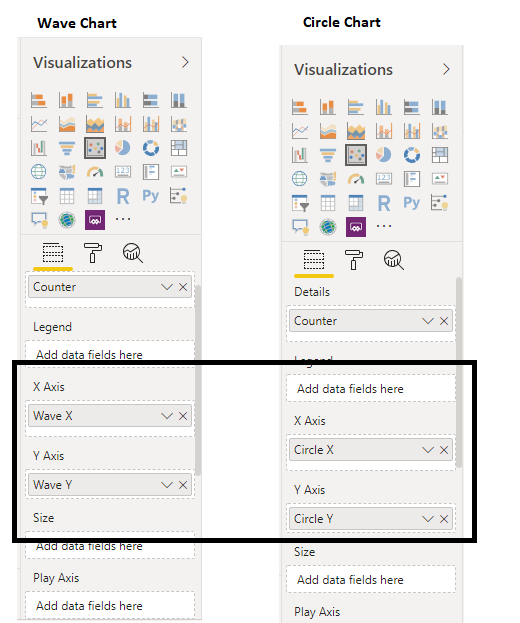
Now drag and drop the Wave X and Wave Y in the Wave Graph and Circle X and Circle Y in the circle graph.
Changing the title of the wave chart
Since its not possible to change the title of the chart dynamically, we will have a workaround to achieve it. this is done by referring to the blog Dynamic Chart Titles in Power BI.
- Create a measure called Wave Chart Title and use the Shape parameter to change its value as below.
Wave Chart Title = if ([Shape Value]=0 , " Sine Wave " , " Cos Wave "
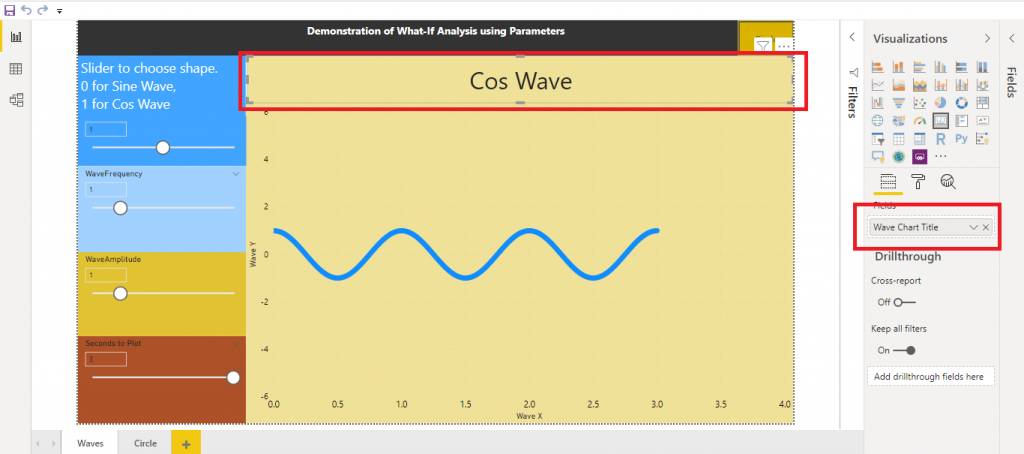
2. Create a KPI visualization and place it on top of the chart and drop the Wave Chart Title in the field section of the visualization
The Final Output
That’s it! We have implemented a What-if Analysis in Power BI using parameters. The final output is a two page dashboard with parameters on the left and button on top right to switch between the Wave page and the Circle page. Then we have the chart title and chart that occupies the remaining of the screen. We wil then apply some formatting for individual components which is better in Power BI compared to Qlik Sense.
Leave a Reply