

Here is the new qliksense extension – bubble chart animated. This is an inspiration from the animation with sliders example of plotly. This is a basic extension quickly created to demonstrate the capability.
Steps to use
Download and Install
- You can download the extension from the below link. If you like to contribute you can also use the GIT HUB
- Extract and copy contents of the folder in the Extensions folder on your desktop or server. It usually is in the My Documents/Qlik/Sense/Extensions folder
Add to the sheet and set measures and dimensions
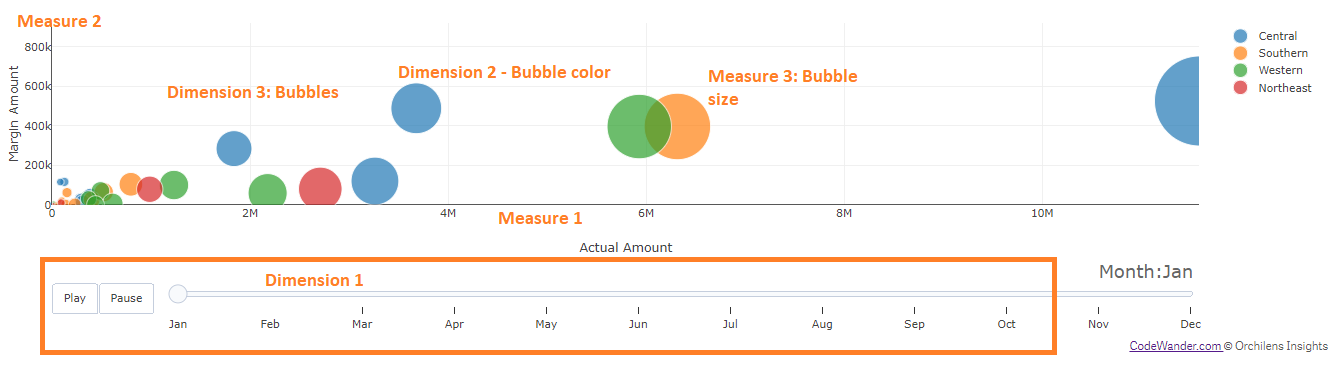
The animated bubble chart will now be available under the custom visualization. The visualization required three measures and three dimensions.
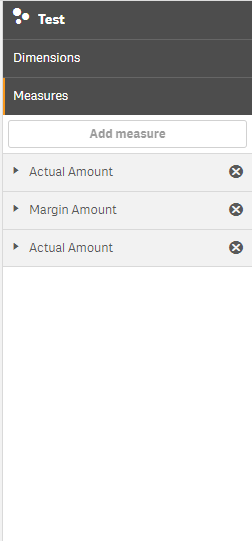
Measures
- The first measure the x-axis
- The second measure is the y-axis
- The third measure is the size of the bubble
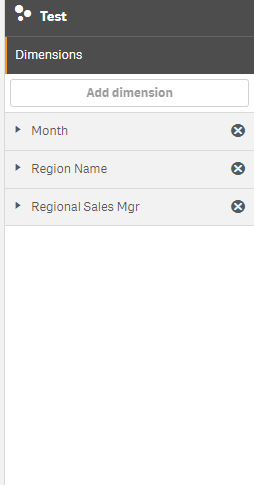
Dimensions
- The first dimension is for the slider
- The second dimension is for color code of the bubble
- The third dimension is the dimension to compute the values of the measures
Options for the chart
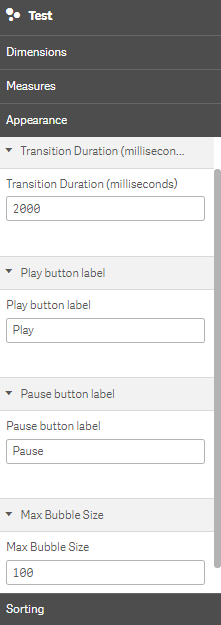
Under Appearance section, you will see the custom options for this visualization
- Transition Duration in milliseconds – This is the duration for the transition from one frame to another frame.
- Play button text
- Pause button text
- Bubble size (25 to 100)
Features
Selection on Click
The second and dimension values of the bubble will be selected.
Advanced built-in features
The plotly graphs comes with some advanced built-in options including lasso select, pan and zoom.You can also download the visualizations as png or export data
![]()
Handling of large data
The default rendering can handle 1000 rows of data. This extension fetches data gradually when the total data exceeds 1000 records. However, the chart will render and refresh as per the data fetched. So the users will not have any delay in seeing the data
Please use it and share your comments.
Update on June 18, 2018
Included 2 options
1. Option to enable or disable scroll zoom
2. Option to show or hide the mode bar
Great extension, thanks a lot.
There is one thing, I cannot manage, however:
I tried to use a aggregated measures like “rangesum(above(sum(revenue),0,rowNo()))”
but failed. Any idea how to manage?