

Qlik view had a powerful feature that lets you change the view of the dashboard in one click. Its the well known cyclic dimension. It lets user choose a different dimension to analyze and the entire dashboard will change to reflect the chosen dimension. This blog is about the qlik sense tips to create a quick cyclic dimension. But my sincere hope is that qlik will introduce cyclic dimension to qlik sense also.
Why Cyclic Dimension?
Imagine a scenario where your analysis is the same but the dimension that you analyze change. So instead of creating a new copy of the sheet you can reuse the sheet but change the dimensions of the charts in a single click.
Why not Alternate Dimension?
Alternate Dimension is the feature of Qlik Sense that comes closer to cyclic dimension. However, it does not give the advantage that cyclic dimensoin provides i.e. change the entire dashboard view.
How to enable a quick cyclic dimension?
Two main features that we will use
- Vairabe input component from Qlik Dashboard Bundle
- Variable
In this blog lets take the Odoo – Point of Sale qlik sense dashboard that I created as part of the Odoo Power BI Qlik sense with Talend series. This dashboard has a single sheet that looks like below.
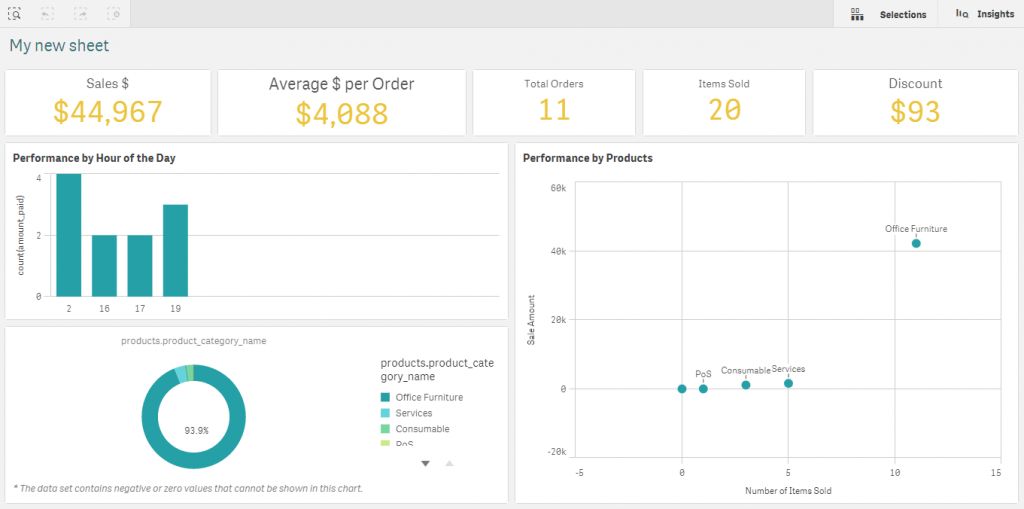
The dashboard is very simple showing Sales metrics on the top and the following charts
- Performance by hour of the day
- Pie Chart – Sales share by product category
- XY Chart – Performance by Products
For the demonstration purpose, lets say that we want the entire dashboard to be shown either by category or product. We want to introduce a second dimension in the performance by hour of the day which can either be product or category. Lets see the steps in achieving it.
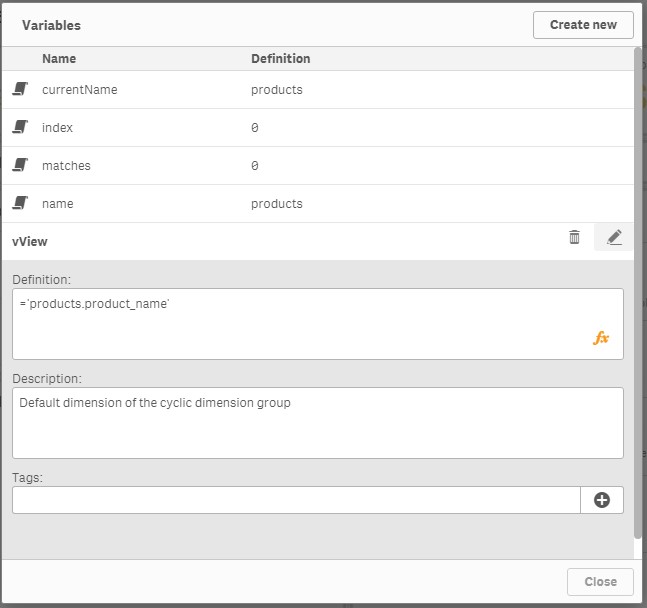
Step 1: Create a variable
The first step is to create a new variable. In this example, I created a new variable called vView and assigned a value. The value must be the field that we want to use as the default dimension. Here I chose products field as my default dimension.
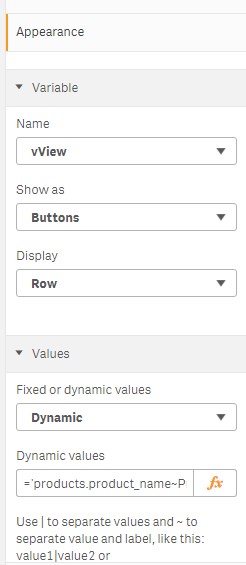
Step 2: Create a Variable Input Component
Drag and drop the variable input component and key in all the categories we want as part of the cyclic dimensions. I chose buttons with dynamic values as it gives option to choose a value and label. This will give a good tab like appearance with user friendly names.
In the dynamic values formula enter the following values to accomodate the product and category field names
='products.product_name~Product|products.product_category_name~Category'
Step 3: Replace the dimensions of the charts with variable name
We have created two basic blocks, namely the variable and the variable input component that will help us in changing the variable name. Now, we will use these variables in the charts that we want to change dynamically.
The dimension that i will use is as follows
=$(vView)
I made the following changes
- Introduced a new dimension for the bar chart
- Replaced the existing category dimension of pie chart
- Replaced the existing product dimension of the XY Chart
Now the entire dashboard looks like below
Limitations: You cannot use this to cycle between two master dimensions. However you can create a master dimension using a variable and make the master dimension itself a cyclic dimension.
Leave a Reply