

Sometime back, I created a dashboard for Odoo Point of Sale using Qlik Sense and Power BI. Today, I thought of experimenting with Amazon QuickSight with the same dashboard requirement. This blog is about my first dashboard using Amazon QuickSight. We will see how to,
- Perpare the data: Import Delimited Flat file
- Create New Analyses
- Publish a Dashboard (No user access management)
Prerequisite
- AWS Account
- Amazon QuickSight Account
You can signup Amazon Web Services for free. However, for QuickSight there are two options. Standard and Enterprise. Standard comes with a $9 per month per user. You also get two month trial period to evaluate the product.
When you signup for QuickSight you get the below screen. If you were going to just experiment like I do, please choose IAM federated identities only.
I also did not choose other options of connecting to other AWS services.
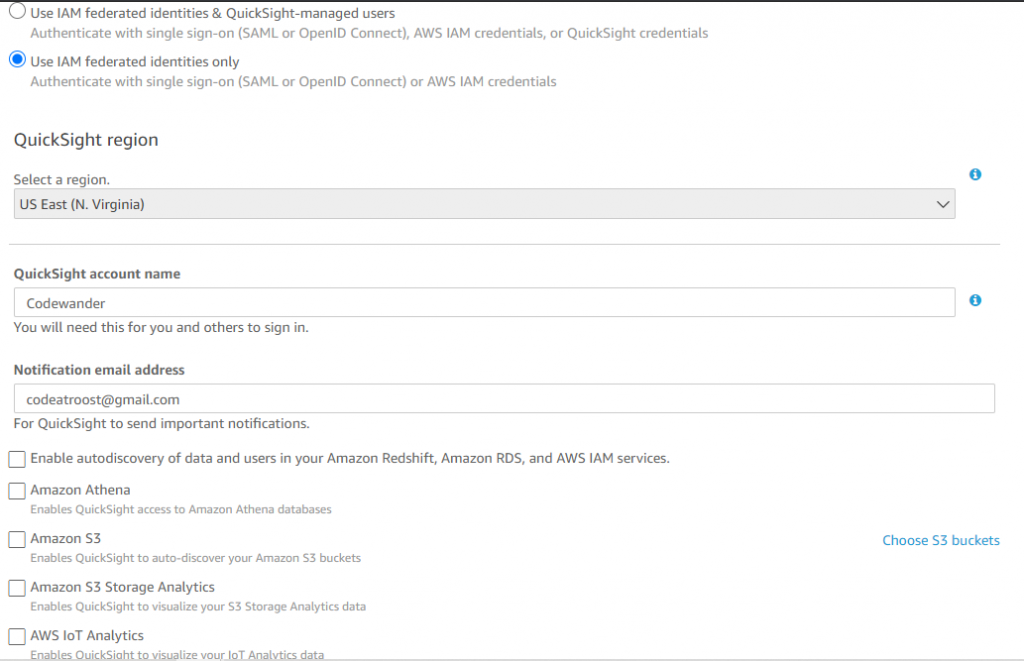
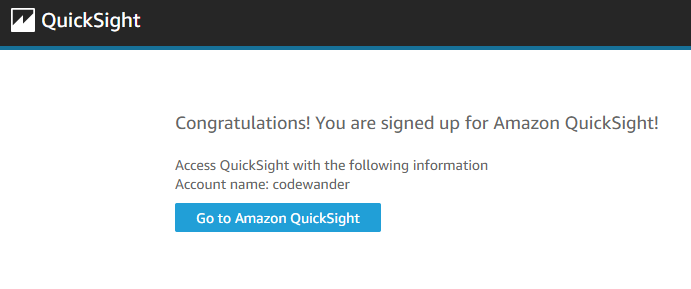
Once you complete the form and submit, you will see a screen like below and you are good to go.
Amazon BI suite and scope for this blog
AWS BI suite has lot of tools that need to be used in tandem for better outcome. Some of the tools that I came across are
- AWS Glue – a complete ETL tool
- AWS Glue Data Brew – Meant for non-IT users to prepare their data for analytics
- Amazon QuickSight – The business intelligence tool for analysis
For this blog, we will focus on Amazon QuickSight and use the simple file that was generated for Qlik Sense and Power BI using Talend.
Amazon QuickSight
The home or the hub
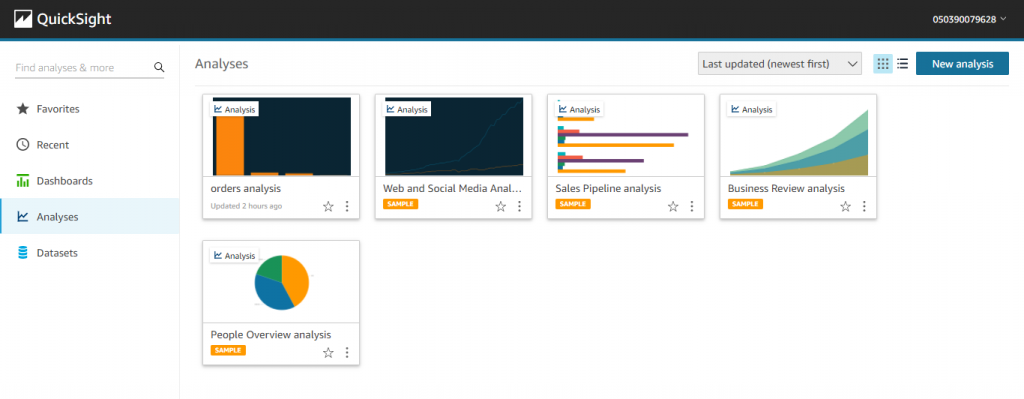
The hub or the home page of Amazon Quicksight has three sections.
- Dashboard
- Analyses
- DataSets
The separation of dashboard and analyses is unique to Quicksight though it may resemble report vs dashboards of Power BI. The data gets refreshed in the analyses section continuously and you have to publish the analyses to update the dashboard. This gives an unique advantage. The analyses section acts like a staging area where you can validate if the data looks good before you publish it to the end users. However, there must be an automatic way to deploy dashboards using APIs (yet to explore). All user access details are added to the dashboards.
Prepare the data: Import Delimited Flat file
For the Odoo Point of Sale experiment, we have three flat files with columns de-limited by a semi-colon. They are
- orders
- orderline – that describes each items in the order and order quantity
- products – contains details of the products in each order
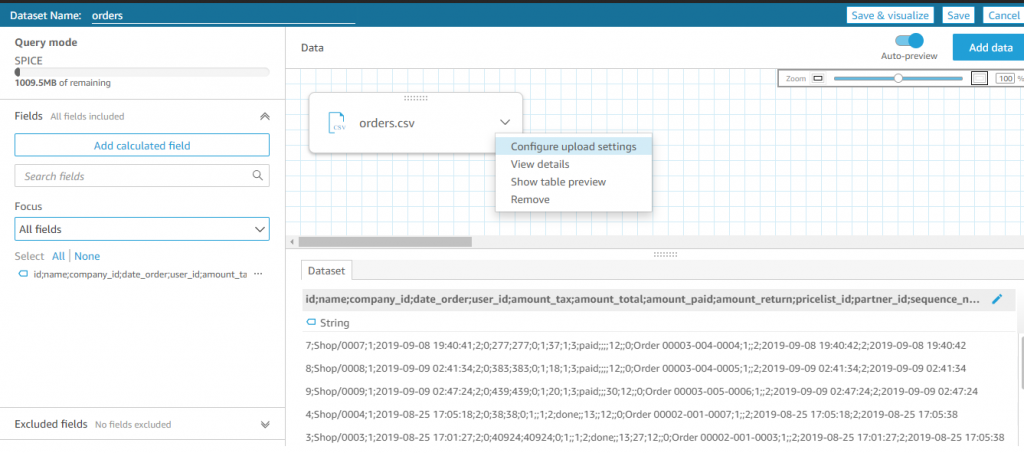
When importing the orders file, the data looked like below. As you can see, the default delimites is comma (,). So the file is not read correctly. This can be resolved by clicking teh Edit settings and prepare data button.
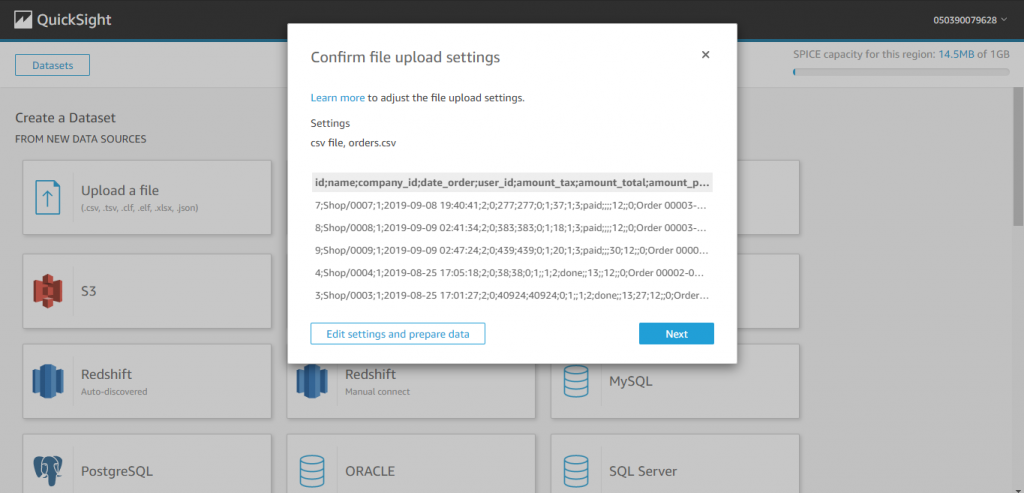
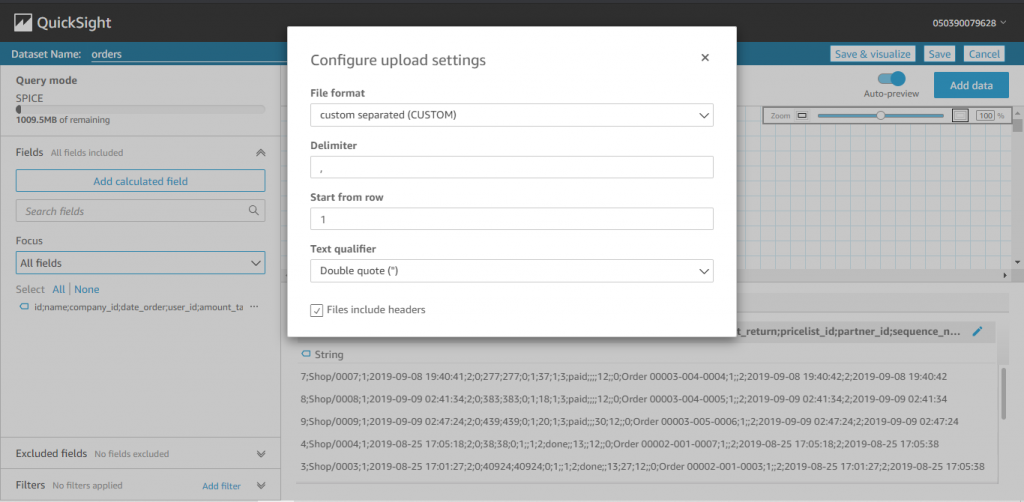
Clicking the arrow of the orders file as shown below will bring another pop-up that lets you set delimiter and header details.
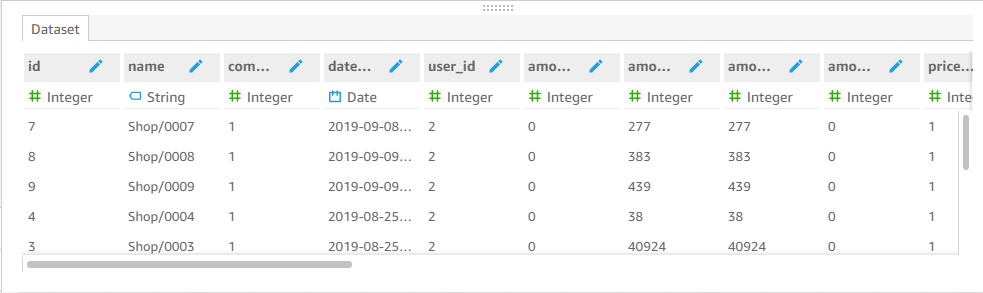
Once all the details are set and the pop-up closed, QuickSight will identify all the columns as shown below
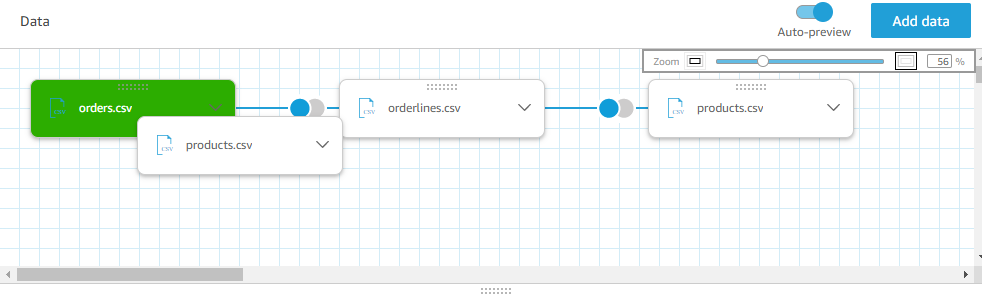
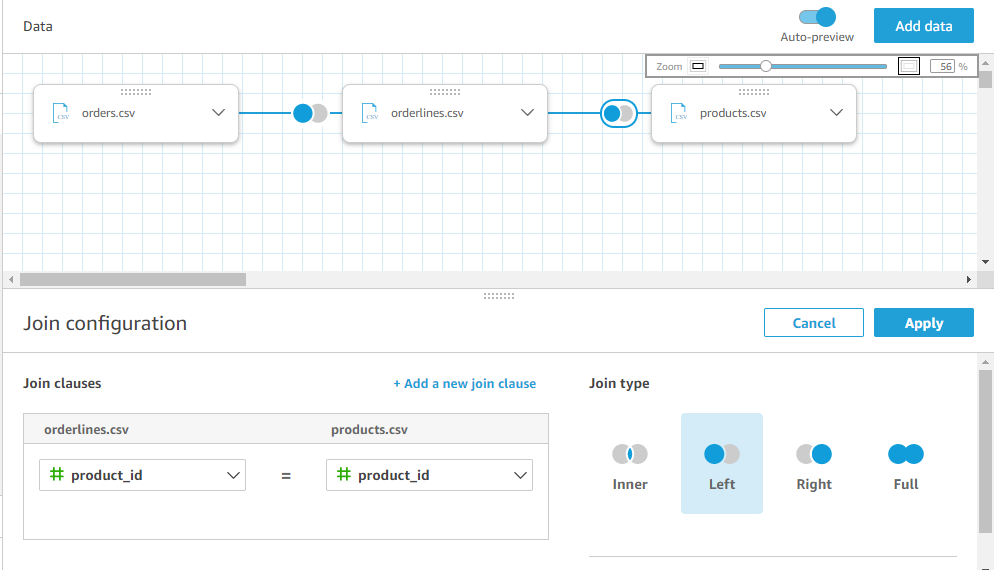
Import and join other files
All the three files can be imported using the same technique and can be joined visually. QuickSight lets you modify join as required using drag and drop.
Create New Analyses
The actual build of dashboard happens in the Analyses section. You can start a new analyses
- From the hub
- Click on New Analyses button
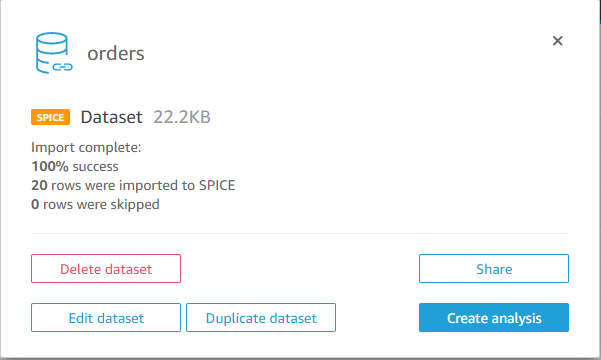
- Click on a data set and then Create Analysis button on the pop-up
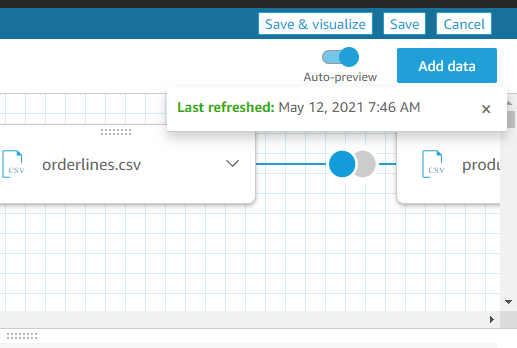
- From within the dataset
- Click on Save & Visualize button on the top right
A data set can be added to an existing analysis as shown below. Click on the pencil icon highlighted and the pop-up will show up to manage the datasets in the analyses.
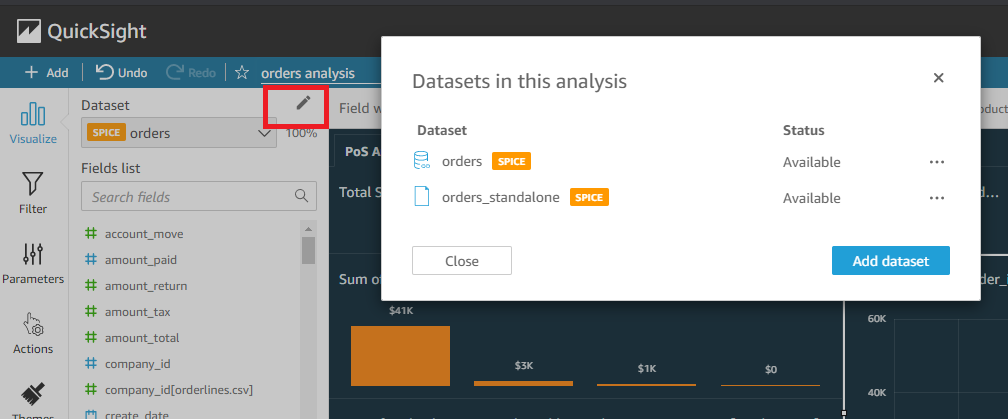
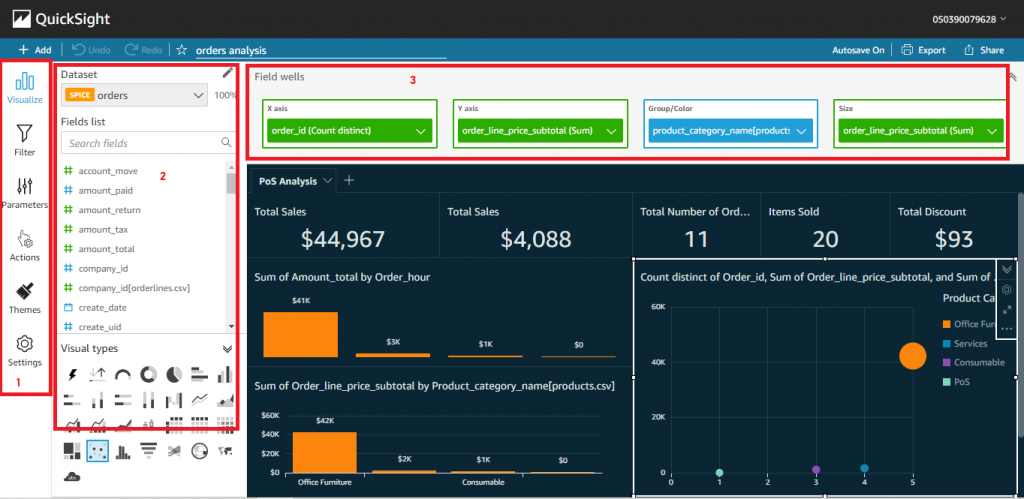
Once the data set is added, the columns are displayed on the left. Now you can simply click on the fields and Amazon QuickSight will automatically create visualizations for you. You can also modify them. We will see some of the key components of the Analyses layout
- Left Navigation: This contains visualizations, filters and parameters, actions. Also you can use the add button above the left pane to add calculated field or parameter at the analyses level
- Left Pane: This is a dynamic pane that changes according to the left navigation selection and for visualization it shows the datasets, list of fields for the selected data sets and the visualizations.
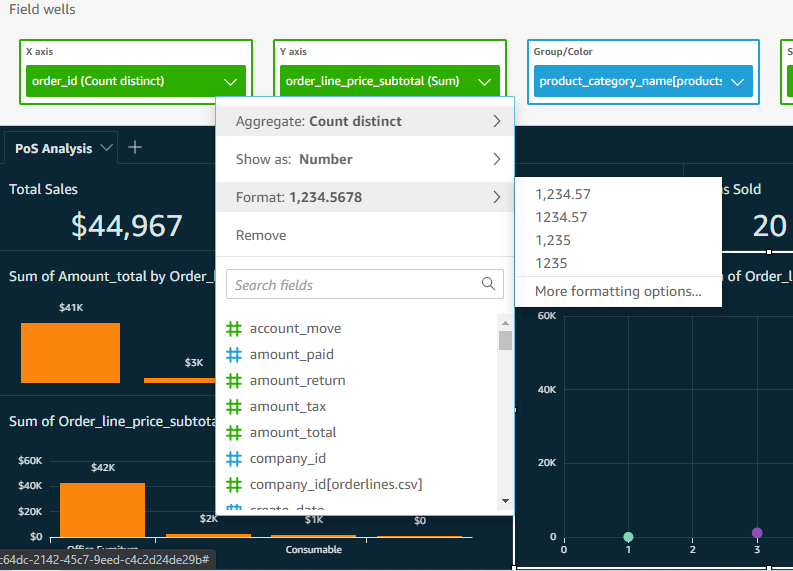
- Field Well: This is the top portion and shows the list of fields we use in a visualization. We can format the fields by clicking on the arrow of the fields.
Publish a Dashboard
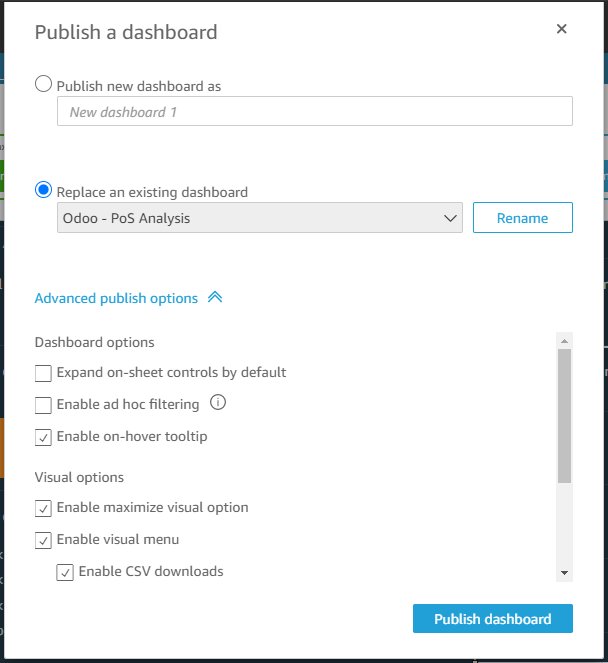
Once you have created an analyses, you can simply use the share button on the top right corner to publish the dashboard. You can either replace an existing dashboard or publish it in a new name.
There are also other options available for you at the time of publish that are self-explanatory.
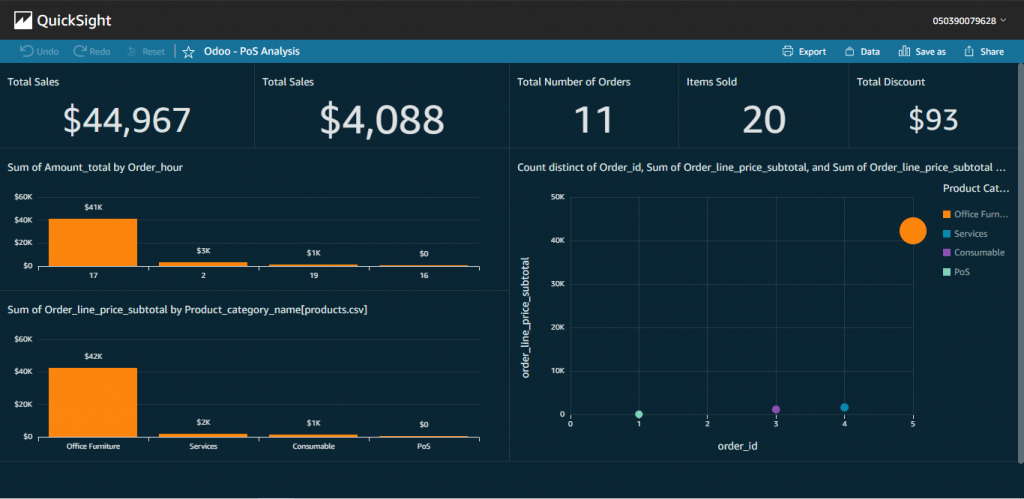
Once you publish the dashboard, it will be available in the Dashboard section of the hub. These dashboards are read only and so it will not have the development components that we saw in the analyses layout. This makes the dashboard look neat by occupying a large screen space. This is a simple dashboard created to demonstrate basic capabilities of QuickSight.
Leave a Reply