

This blog is about the my makeover monday week 4 Tableau visualization submission. The week 4 visualization is regarding the geo spatial visualization of Bridges2Prosperity organization that focuses on building bridges across the word to improve the lives of rural population. The visualization that we makeover this week is below. You can also check out my Makeover Monday Week 3 visualization Analysis
We will makeover the visualization as below. In this blog we we will see how I arrived at the below visualization. You can also check out the live Tableau dashboard
Objective of Makeover Monday 2020 Week 4
- What works and what doesn’t work with this chart?
- How can you make it better?
Analysis
What works with this chart?
This chart does a good job of showing the global indicators when a country is selected and also the geo heatmap of a selected global indicator. It is easy to look at an individual country’s numbers and also the overall comparative view.
What does not work with this visualization?
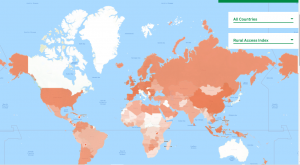
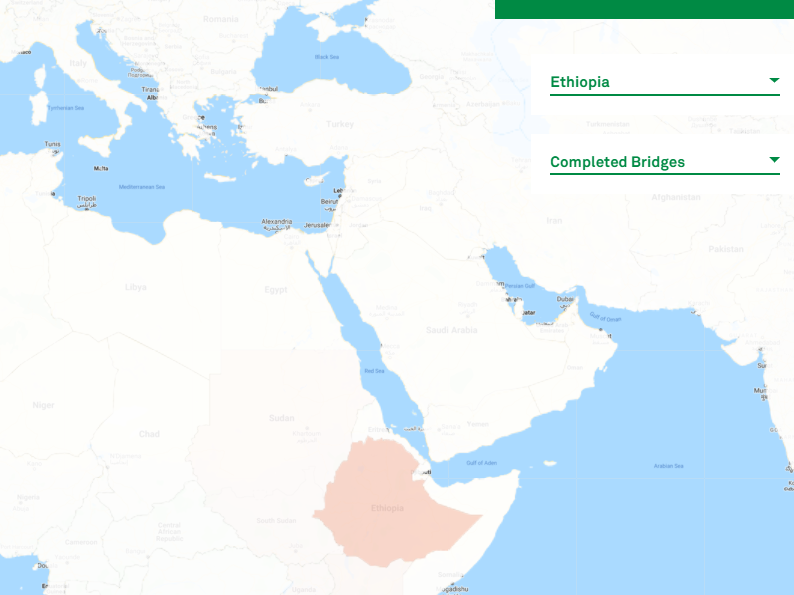
- The visualization does a poor job of highlighting the global indicator on the map when a country is selected. It still gives the heat map but zoomed to the country selected. This is of no use as there is no way to compare when the map is zoomed in.
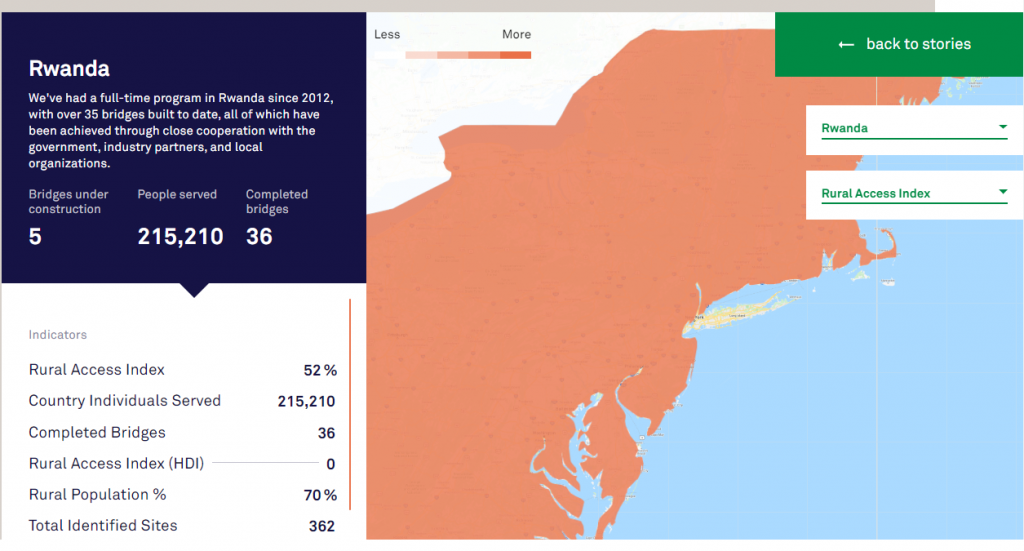
- The chart does not visualize the location of bridges on the map. For example, in the image below, it does not sow the geo location of the completed bridges in Ethiopia.
How can we make it better?
Remove Global Indicators from the map
Use table heatmap instead
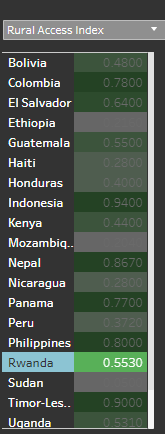
First we will address the global indicator on the map that comes up when we select a country. We will instead use a simple heatmap table with a dropdown for the indicators. This simple heatmap will easily show us the comparative view and the sorting feature will enable us to find the ranking of the country easily. We will also use this a filter to select a specific country
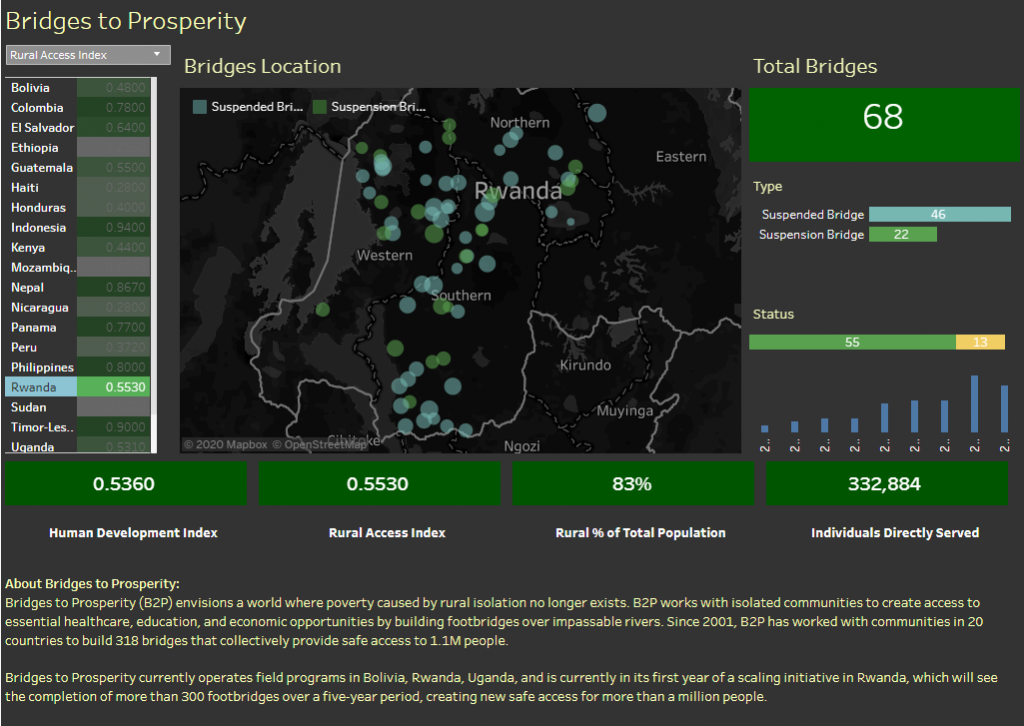
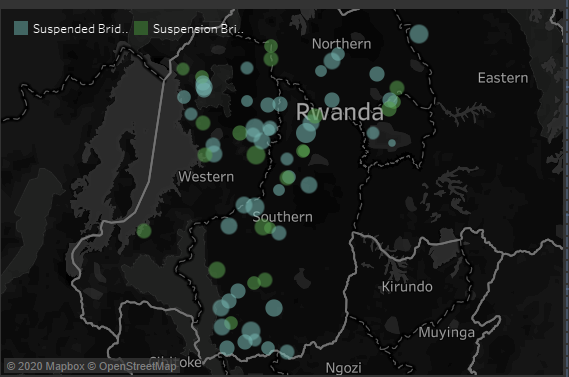
Plot the location of bridges on the geo spatial map
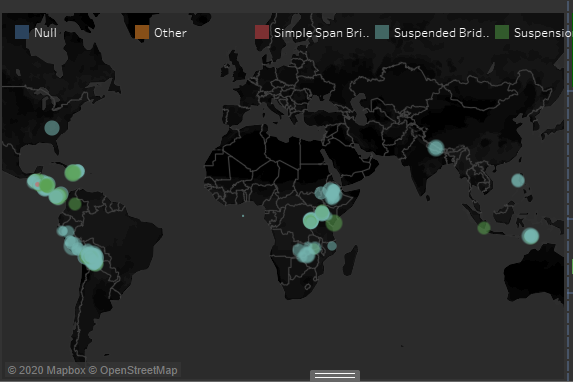
Next we will address the missing feature, which is the plotting of bridges based on location. We will use the geo map to plot the location of the bridges and highlight the bridges in different colors based on the type of bridge. The size of the bubble shows the span of the bridge in meters. When we select a country, the map zooms in to that country and shows the bridges. When we deselect all the countries, that map zooms out and shows all the countries with bridge heat map on it. Please see below.
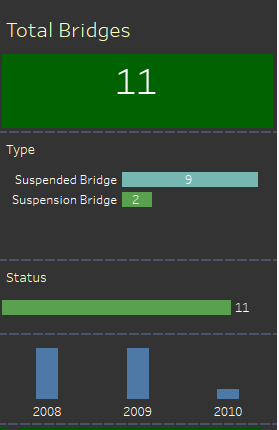
We will provide following additional information about the bridges. Number of Bridges by:
- Type
- Stage (Completed or not)
- Year constructed
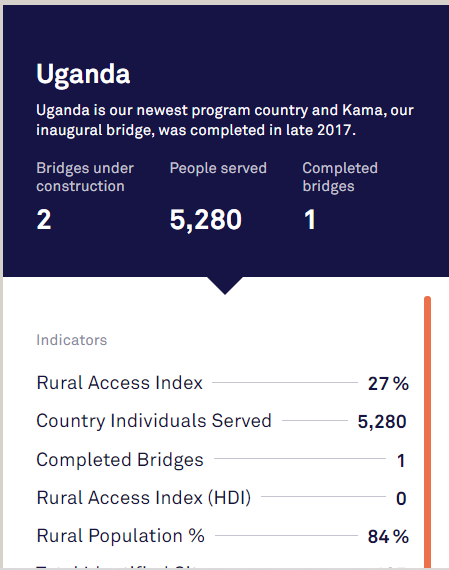
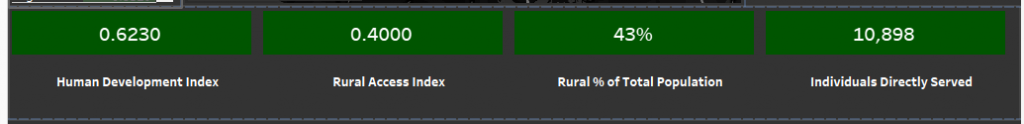
Retain the good feature: List Global Indicators for a Country
When we select a country we will also list all the global indicators of the country. When none of the countries is selected we will hide these global indicators as it does not make sense.
Final Output
The focus of the makeover is to ensure that we do not use more components than necessary and provide as much insights as possible. Thus putting all these components together, we get the below output. As you can see we also added a text object to give a brief introduction about Bridges2Prosperity organization. Please provide feedback on the analysis and also on the technical approach.
Tabeau Tips and Tricks
Since I am new to Tableau, I had to learn lot of new tricks to achieve this visualization. Some of the tricks are:
- Using Parameters to dynamically change the measures
- Use bar chart as KPI tile element
- Using Dashboard Action to hide the Global indicators based on condition
Since this blog is mainly focused on non-technical aspect, I will write another blog that explains these technical details.
Leave a Reply