

Qlik sense has got themes to have your custom color for the overall dashboard, the charts and its components. However, in practice we all encounter a situation where we use Red, Amber and Green to indicate the nature of metrics/ KPIs. While its easy to arrive at a standard set of colors, quite often, you will be required to change these color through out the design and development phase. This Qlik sense tips, explains how to set up standard red, green and amber colors using segment colors and variables for your dashboard once and use it everywhere. For more qlik sense tips, click here.
Using Segment Colors of Master Measures
One way to standardize Red Amber Green for metrics/ KPIs is to create them as master measures and use the segment colors to determine red, green and amber. The following image shows the segment color options of a master measure. We can click on the color bars to choose a different color.
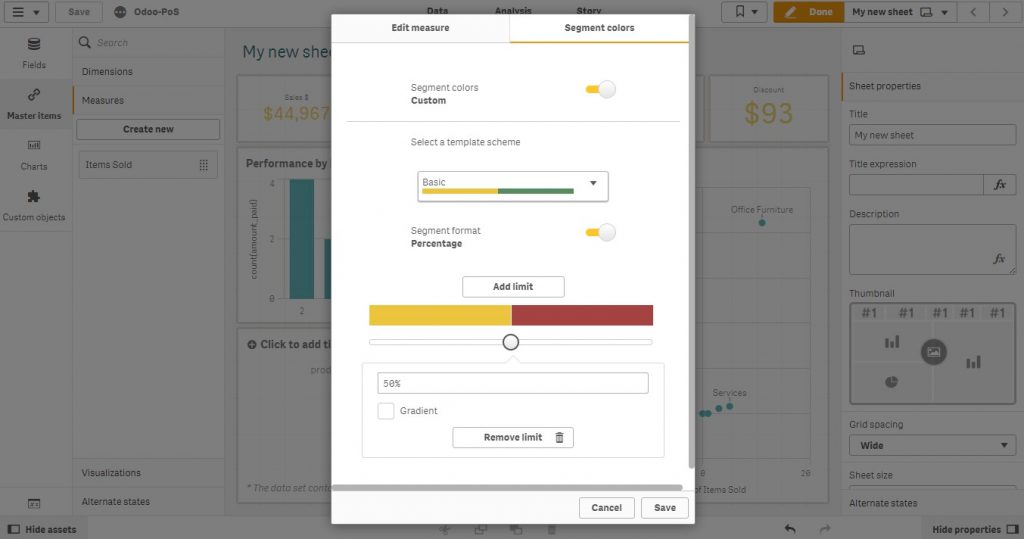
This way we can define Read, Amber and Green for a master measure and use it else where.
Advantages of using segment colors
No matter where the master measure is used, the segment color can be enabled thus highlighting the metric/ KPI in all the places uniformly.
Limitations of using segment colors
- The color setting is scoped to one master measure. So you will have to ensure that we write the same color code for each and every metric/ KPI that requries RAG (Red Amber Green) code.
- Also, if the RAG color changes in future, we have to change the segment color definitions of all the metrics/ KPIs. This may be easy for a small dashboards but for larger dashboards it may be a maintenance issue.
- The segment color assumes that Red, Green and Amber color is based on the measure’s absolute value. Thus making it useless in cases where the target or condition is based on another field or expression.
Using Variables
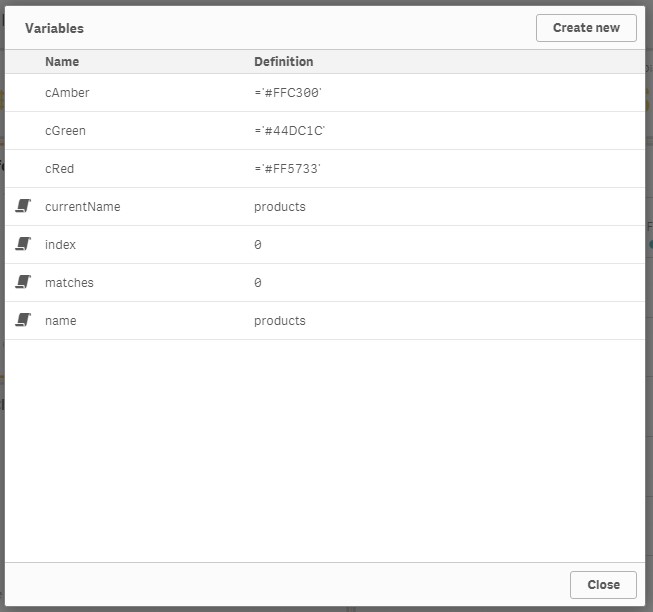
Qlik sense provide a powerful concept, variables that has numerous application in managing the behavior of a Qlik sense app. We can use variables to store standard colors for red, green and amber and use it in all conditional color coding as follows.
First, Create create variables
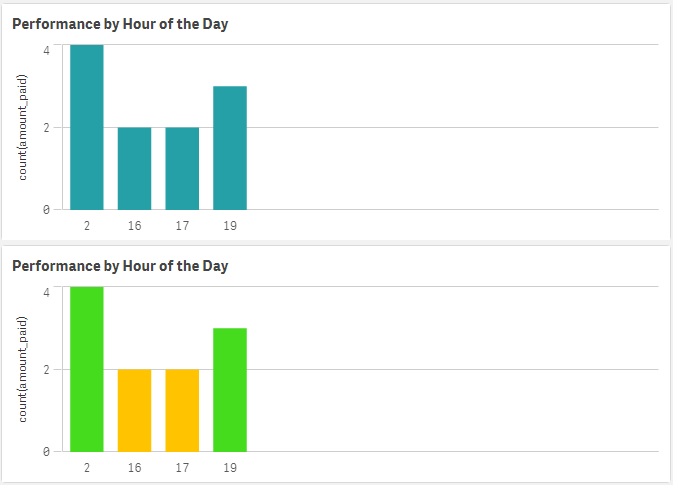
Second, use these variables in color by expression under Colors and Legend as below. In this case, we will add color by expression for the bar chart “Performance by hour of the day”.
Conditions to color code hours:
- more than two sales is green,
- two sales is amber and
- one or no sales is red.
Following is the expression and the picture shows the before and after view of the bar chart.
You can also check out my blog on how to color code combo chart based on condition.
=if (count(amount_paid)>2,cGreen,if( count(amount_paid)=2,cAmber,cRed))
Advantages of using vairables
We can re-use the varaibles in all the places where we can use color by expressions across all the measures and visualizations. This is like an extension of Qlik sense’s default colors like red, green and yellow but with custom color codes as per the organization’s theme
Limitations of using variables
We cannot use variable with KPI Object in its limit section. There we have to use the color code directly. In such cases, if Qlik enables formula in the segment color target limits, it will be easier to manage the colors across the metrics/ KPIs and visualizations using variables
Leave a Reply