

Most of the leading visualization analytics products have realized that the individual needs on visualization is never ending and have made their system open to integrate custom visualizations. Both Qlik Sense (Qlik Branch) and Power BI (Custom Visuals) have strong community and commercial partners that create custom visualizations. I tried to layout a visualization extension evaluation matrix to evaluate these third party extensions for production usage.
This focuses on the extension/ product and not on the vendor evaluation and support model as each company depending on its size and compliance requirements will have different expectations from the vendor.
Note: The extensions that I create are to demonstrate the possibility and let the interested people take it forward with their implementation. It is not intended for production use yet.
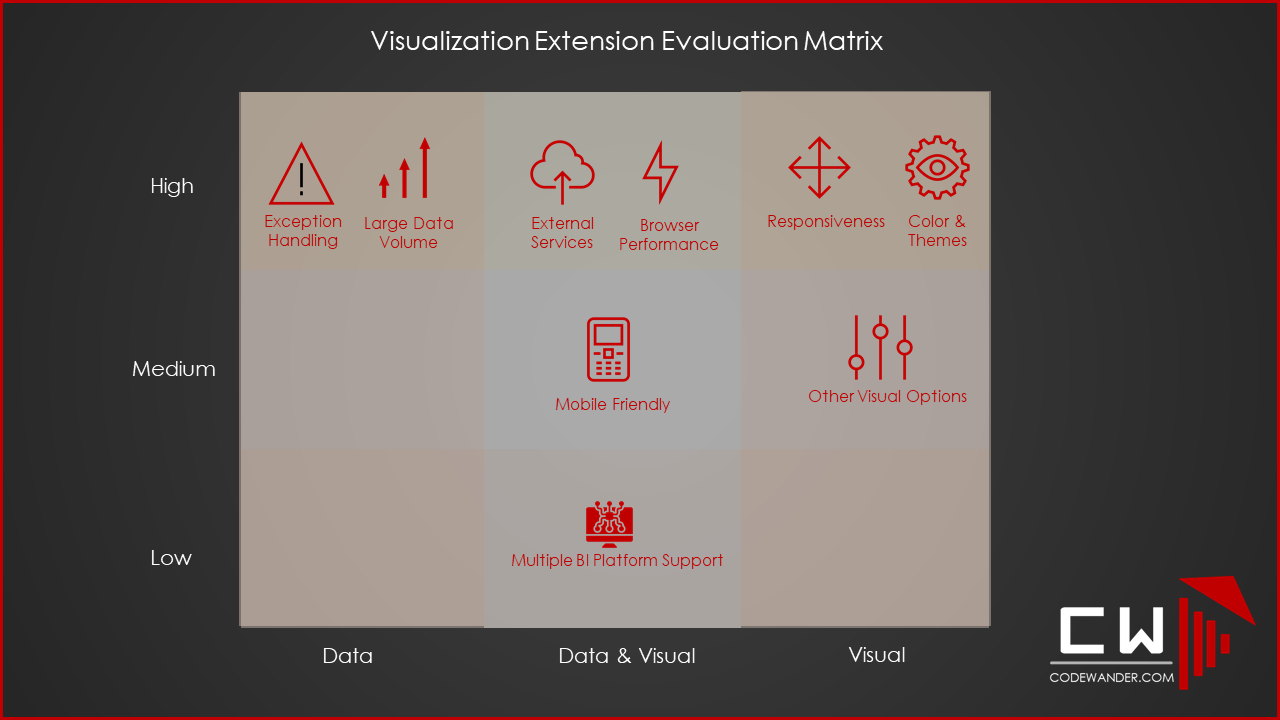
The Visualization Extension Evaluation Matrix
When we evaluate a visualization extension, we need to consider primarily on two aspects: Data and Visual. The following list revolves around these two aspects. I try to put a quadrant to show what is more critical in general but it always depend on your purpose.
Handling of Exceptions

Exceptions in your data is inevitable. This could be because of the quality of the data or due to genuine business reasons. The extension must be able to handle these exceptions gracefully and give a user friendly error message so that user understands the data better.
Handling of Large Volume of Data
As your data grows, the visualization must be able to handle large volume of data both in fetching and rendering. If the data is huge there is a high possibility that the extension fetches only a partial data. So evaluate how the extension fetches large volume of data.
Another important aspect is the ability to render large volume of data. One must understand the visualizations are to tell a story, call out exceptions and identify pattern and not to read each and every row of data unless its some of table, say, P&L View. So please check how rendering of large volume of data is handled in the extension
Use of external/ cloud services

This is critical especially in large enterprises where there are strict policies to send data outside your network. Please ensure that the extension does not call any external services to render the visualization. If it does, please make sure that you get all the approvals necessary to use it. Sometimes, you may be able to make it work in your local machine and test environment but not in production due to firewall and so on.
Browser Memory Leak

This may seem trivial but most of the times this is overlooked and can cause trouble for end users. Please ensure that the new extensions does not cause memory leak and any other performance issues especially when handling large volumes of data
Responsiveness

This is critical even if you do not need any mobile support. The leading BI tools’ canvas is a grid system. The user (developer or self-service) can change the width and height of the extension with in the canvas. So the responsiveness is a critical aspect of a visualization extension even for a desktop only solutions.
Mobile Friendly

This is optional and depends on the mobile usage of the BI platforms by you or your organization. Ensure that it works in the mobile apps of the BI Platform that you use and also on the default browsers of the prominent mobile devices that your target audiences use.
Color/ Theme Variability

This is a critical part of a visualization extension. The extension must have the ability to change the color or theme of the extension to suit your dashboard theme. Each organization have their own theme or guidance and the extension must be able to blend in.
Other Visual Options

There could be other options like font, data labels which might be critical for you or your organization. Please ensure that the extension is able to cater to it.
Support for other BI Platforms

This is very rare but possible in large enterprise scenarios where more than on BI platform co-exist. If you work with a vendor for an extension or an extension library, you can check if they support the platforms that are in your ecosystem. This will ease your time to rollout the feature/ extension to other platforms.
This matrix will cover major aspects of extension evaluation. If you have further items that can make the evaluation exercise more robust, please share.
Leave a Reply